The natural rhythm of conversation depends on knowing when to start speaking and when to stop. Humans handle this effortlessly: we sense the end of a turn, we recognize a quick “uh-huh” as encouragement rather than an interruption, and we can stop mid-sentence when someone clearly needs to break in. Voice AI agents have struggled with all three.
Last year we introduced Krisp Turn-Taking, the first audio-based end-of-turn prediction model designed for Voice AI. Then we shipped v2, with substantial accuracy gains and integration into the Krisp VIVA SDK. With this release, we’re expanding what Turn-Taking means at Krisp.
Krisp Turn-Taking: Turn Prediction v3 and Interruption Prediction v1
Krisp Turn-Taking now comprises two complementary models:
- Turn Prediction v3 — our end-of-turn prediction model, substantially faster and more accurate than v2, and now multilingual.
- Interruption Prediction v1 — a brand-new model that distinguishes between backchannels (short acknowledgments like “yeah” or “uh-huh”) and genuine interruptions when the user wants to take the turn and interrupt the speaking AI agent.
Together, they cover both halves of the turn-taking problem: knowing when to speak, and knowing when to stop. The naming reflects the maturity of each component: Turn Prediction has reached v3, while Interruption Prediction is introduced as v1.
Headline gains in this release:
- Fast responses (under 200 ms) jumped from 47% to 69% compared to v2, without increasing the risk of interrupting the user mid-sentence.
- Better latency-accuracy curve for end-of-turn prediction
- Introduction of Interruption Prediction v1 — a game-changing approach to interruption handling that significantly outperforms VAD- and word-count-based methods
- The test dataset used in our end-of-turn prediction evaluation is now public on HuggingFace: Krisp-AI/turn-taking-test-v1
Architecture overview
Turn Prediction v3
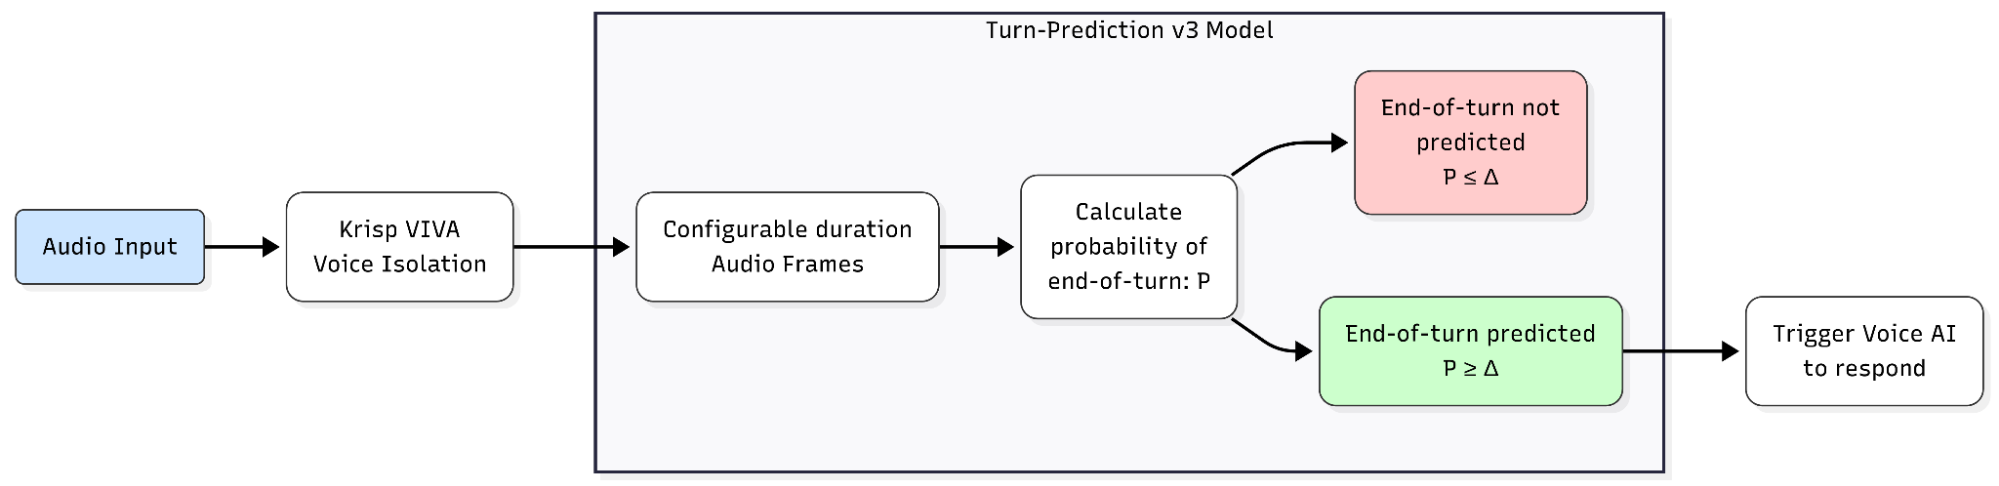
Turn Prediction v3 listens to conversational audio and outputs a probability between 0 and 1 that the speaker has finished their turn. The probability is progressively refined during the silence period that follows speech — so the model can react quickly when the end of the turn is clear, and hold longer when it isn’t yet.
The model:
- Operates on audio frames of configurable duration (e.g., 40 ms segments)
- Returns a probability per frame, with the binary end-of-turn decision controlled by a configurable threshold (default 0.5)
- Is multilingual: supports English, German, French, Spanish, Hindi, Finnish, Italian, Portuguese, Chinese, Japanese, Korean, Russian, and additional languages
Interruption Prediction v1 — a new capability
Interruption Prediction v1 addresses a problem most voice agents handle poorly: the difference between a backchannel (short acknowledgments like ‘yeah’ or ‘uh-huh’) and an interruption.
When a human says “yeah” while the agent is speaking, they’re encouraging the agent to continue — not interrupting. When they say “wait, hold on”, they want the agent to stop. Most current systems use crude heuristics: VAD on any sound (which fires on every “uh-huh”), fixed timing thresholds, minimum word counts, or stop-word lists. The result is bots that interrupt themselves on backchannels or fail to stop when the user genuinely needs to speak.
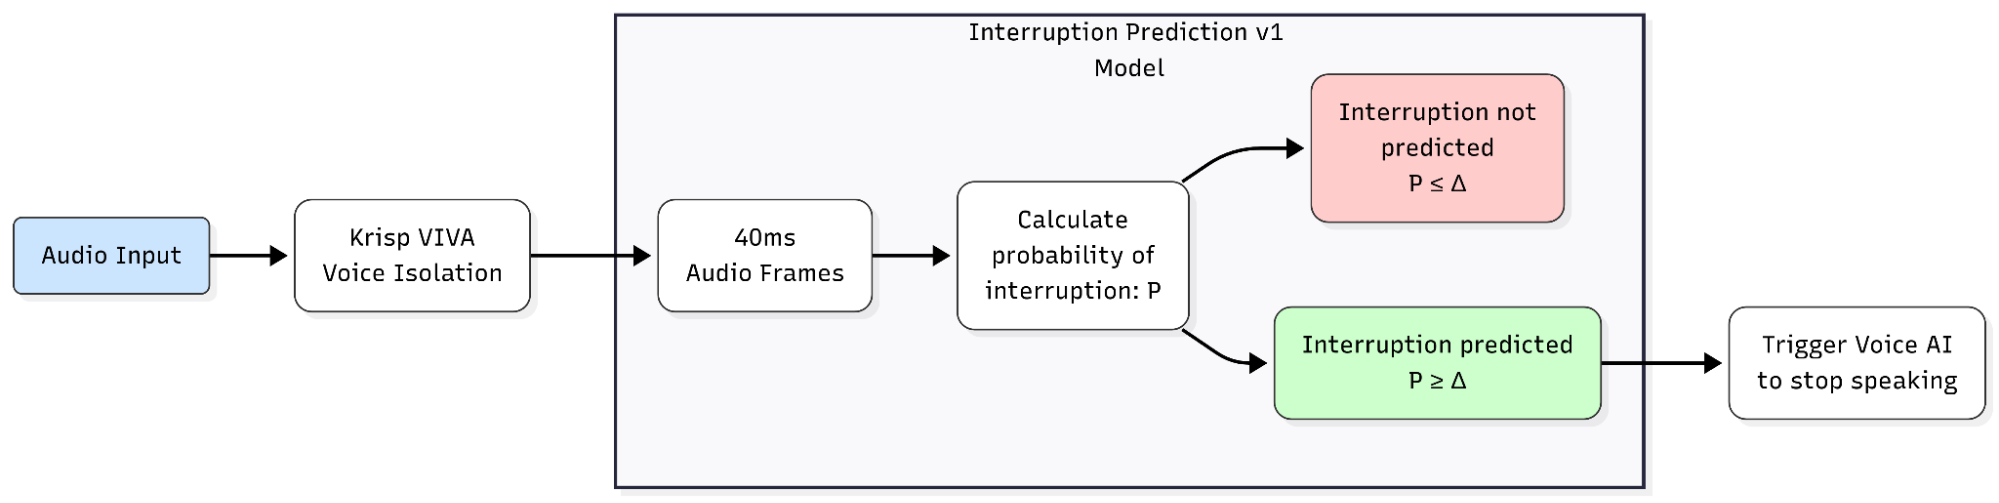
Interruption Prediction v1 takes a different approach. It produces a probability/confidence rate between 0 and 1 that the user genuinely intends to interrupt. The probability is progressively refined during the user’s speech segment, distinguishing intent from acknowledgment without waiting for the user to complete a full sentence.
The model:
- Operates on audio frames of 40 ms duration
- Returns a probability per frame, with the binary interrupt decision controlled by a configurable threshold (recommended default 0.4)
- Supports English-only at v1
Symmetry by design
The two core models share an evaluation philosophy and a mirrored mechanism for turn-taking decisions: Turn Prediction refines its probability during the silence after speech, while Interruption Prediction refines its probability during the user’s overlapping speech.
Specs at a glance
| Model |
Parameters |
SDK Size |
SDK Name |
Frame |
Languages |
| Turn Prediction v3 |
~9M |
30 MB |
krisp-viva-tp-v3 |
configurable |
12+ |
| Interruption Prediction v1 |
~6M |
24 MB |
krisp-viva-ip-v1 |
40 ms |
English |
Both models run efficiently on the CPU and are included in the Krisp VIVA SDK.
Evaluation methodology
Turn-taking models trade off two things: how accurately they predict turn boundaries, and how quickly they react. A model that gives accurate predictions but waits too long to respond will feel sluggish; a model that fires after 100 ms will feel snappy but will cut users off mid-thought. Single-number metrics like accuracy or F1 hide this trade-off.
In our v1 blog post we introduced the latency–accuracy curve as the right way to think about end-of-turn prediction. With this release, we extend the same philosophy to interruption prediction.
Mean Shift Time vs False Positive Rate
For Turn Prediction we use two coupled metrics.
Mean Shift Time (MST) measures latency. Given a set of true turn-shift cases S and a model that outputs probability Pi(t) at time t after the end of speech, MST at threshold τ is the average time the model takes to declare a shift across all true-shift cases:
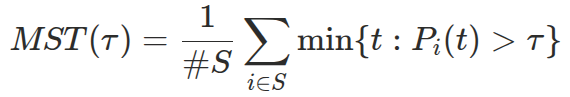
If a silence is shorter than the time needed to cross the threshold, the silence is conceptually extended — we measure when the model would have fired.
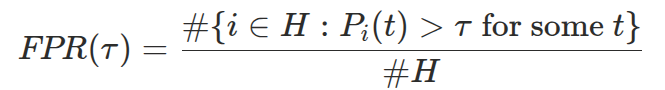
False Positive Rate (FPR) measures accuracy on the negative class. Given a set of true-hold cases H (where the speaker pauses but does not finish their turn), FPR is the fraction of holds where the model erroneously crosses the threshold at any point during the silence:
Sweeping the threshold from 0 to 1 traces out a curve in the MST–FPR plane. Lower curves are better — they mean faster reaction at any given accuracy level.
Mean Interruption Time vs False Positive Rate (Interruption Prediction)
The same logic extends to interruption prediction. The latency metric is Mean Interruption Time (MIT) — the average duration between the moment the user begins speaking over the bot and the moment the model classifies that speech as an interruption rather than a backchannel.
Higher thresholds mean fewer false interrupts on backchannels, but the bot is slower to stop when the user genuinely wants the floor. Lower thresholds mean faster cutoffs, but a greater chance of the bot stopping during a quick “uh-huh.” To visualize this trade-off, we plot a chart showing the relationship between mean interruption time (computed on true-interruption examples) and the false-positive rate (interruptions during backchannels) as the threshold is varied from 0 to 1.
For baseline methods that don’t expose a confidence score (e.g., VAD-based, minimum word count), we plot a single point at their (MIT, FPR) coordinates rather than a curve.
Test datasets
For Turn Prediction, evaluation runs on the Krisp-AI/turn-taking-test-v1 dataset, which we are publishing on HuggingFace alongside this release:
- 4 hours of conversational audio
- 30 speakers
- 976 manually labeled shift cases
- 1,754 manually labeled hold cases
The original recordings consisted of long-form conversations. These recordings were first reviewed and labeled manually by human annotators. After labeling, the conversations were segmented into shorter clips, ensuring that each segment preserved the context needed for accurate interpretation while maintaining alignment with the original annotations. We also retained the last silence segment of each clip and recorded its duration in the metadata, enabling false-positive-rate calculation and analysis of the MST vs FPR trade-off.
We also evaluate on two derived variants: secondary mixes (with additional secondary voices added to simulate cross-talk) and noisy mixes (with realistic background noise). Both stress-test how the model behaves in the challenging conditions of real-world deployments.
To assess the contribution of Krisp’s Background Voice and Noise Cancellation (BVC), we report results both before BVC (raw audio) and after BVC (audio cleaned by Krisp’s BVC model). BVC is a standard component in Krisp deployments — TT models in production receive BVC-cleaned audio.
For Interruption Prediction, the test set consists of 1,721 audio segments collected from natural interactions:
- 1,182 backchannel cases
- 539 interruption cases
We additionally evaluate robustness on non-verbal human sounds: 200 laughter samples, 100 cough samples, and 100 sneeze samples.
Results: Turn Prediction v3
Threshold selection
Turn Prediction v3’s behavior is controlled by a single threshold. We benchmarked across the full threshold range and identified three operating points corresponding to low, medium, and high accuracy levels. The binary prediction evaluations for each are shown below (for the definitions of these metrics, see our first blog post).
| Threshold |
Balanced Accuracy |
AUC |
F1 Score |
F1 Score Hold |
| 0.3 (low) |
88.00 |
94.09 |
83.37 |
89.29 |
| 0.5 (medium) |
87.85 |
94.09 |
84.15 |
90.98 |
| 0.7 (high) |
85.58 |
94.09 |
82.07 |
90.93 |
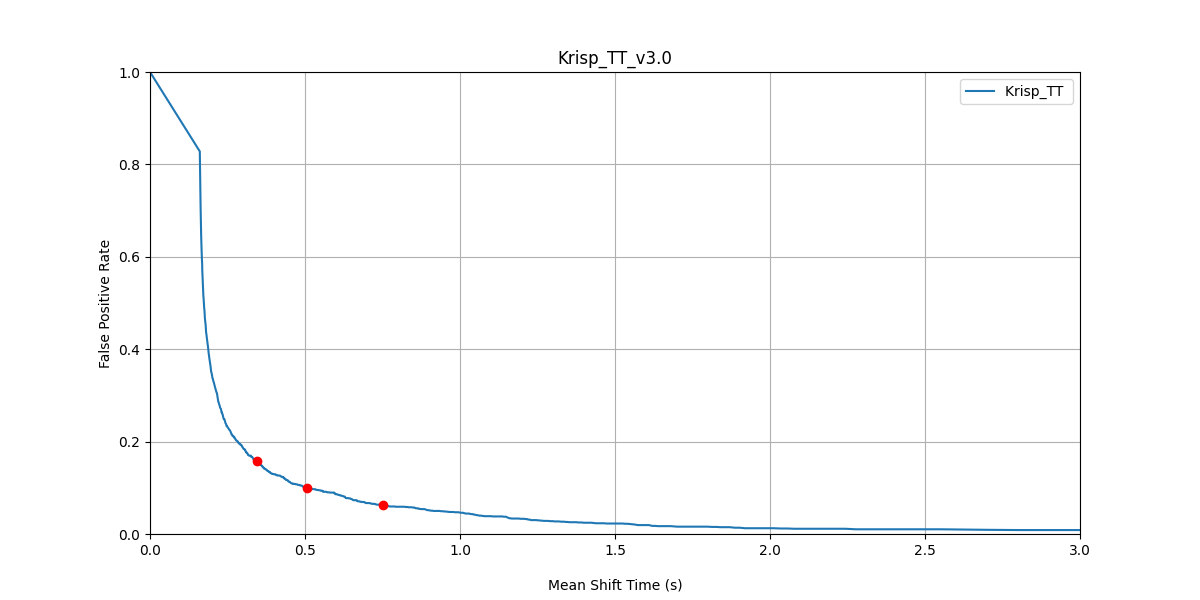
Krisp TT v3 — False Positive Rate vs Mean Shift Time across the threshold range. The three red dots mark thresholds 0.3, 0.5, and 0.7.
We recommend threshold 0.5 as the default operating point — it balances reaction speed and accuracy. All Turn Prediction v3 results below use 0.5; Turn Prediction v2 results use 0.4.
Turn Prediction v3 vs v2
Comparing v3 directly against the previous generation on identical test conditions reveals the magnitude of the improvement.
Original dataset:
|
True ≤ 200 ms |
True ≤ 400 ms |
True ≤ 600 ms |
False Positive Rate |
| Turn Prediction v2 |
0.47 |
0.57 |
0.64 |
0.11 |
| Turn Prediction v3 |
0.69 |
0.73 |
0.76 |
0.10 |
The headline result: at the same FPR, v3 catches 47% more true turn-shifts within the first 200 ms of silence. An agent’s responsiveness can be substantially enhanced by this contrast.
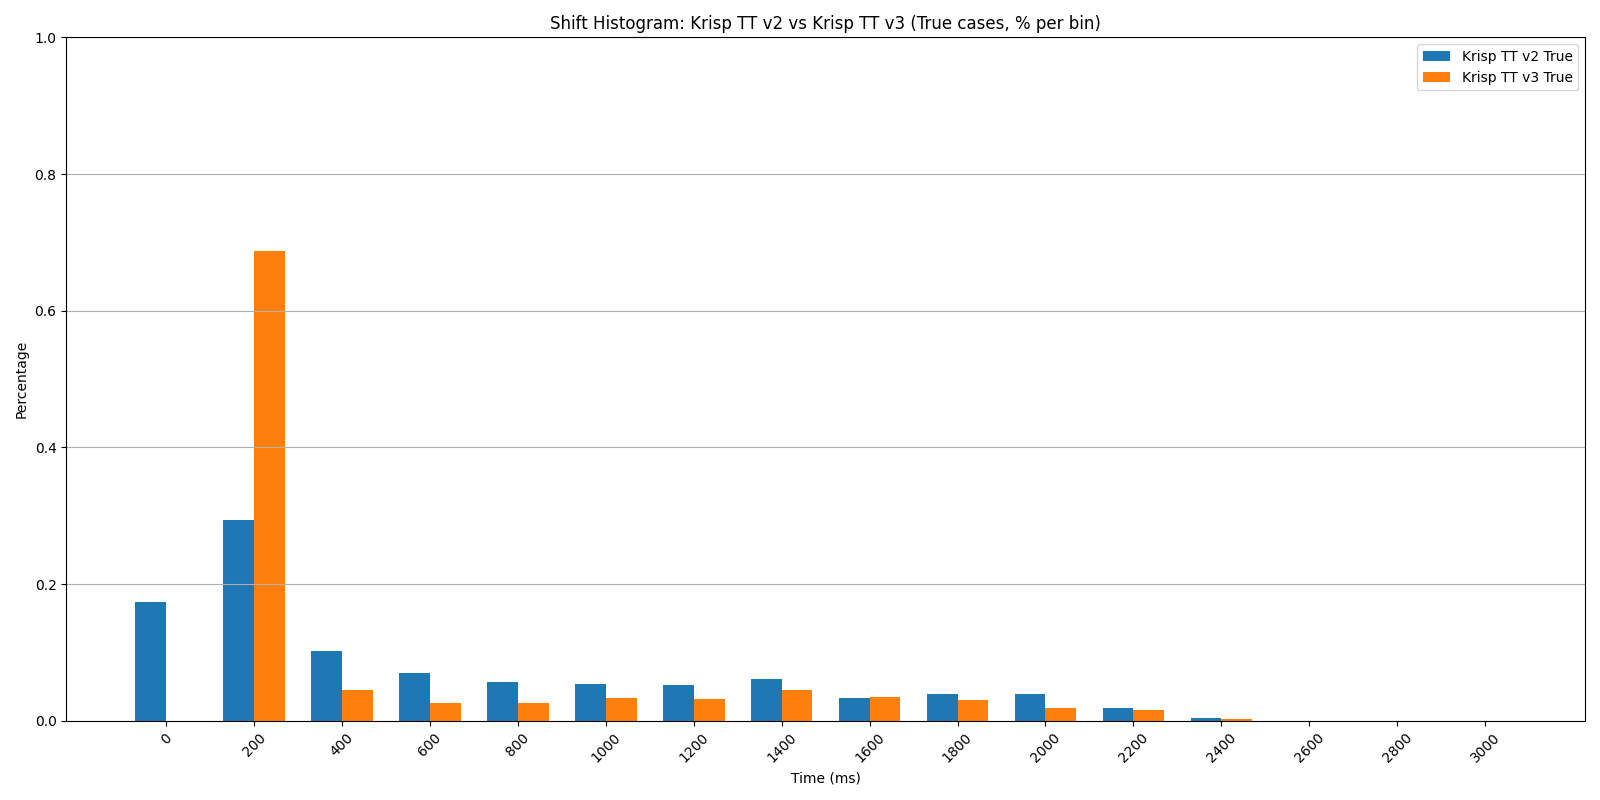
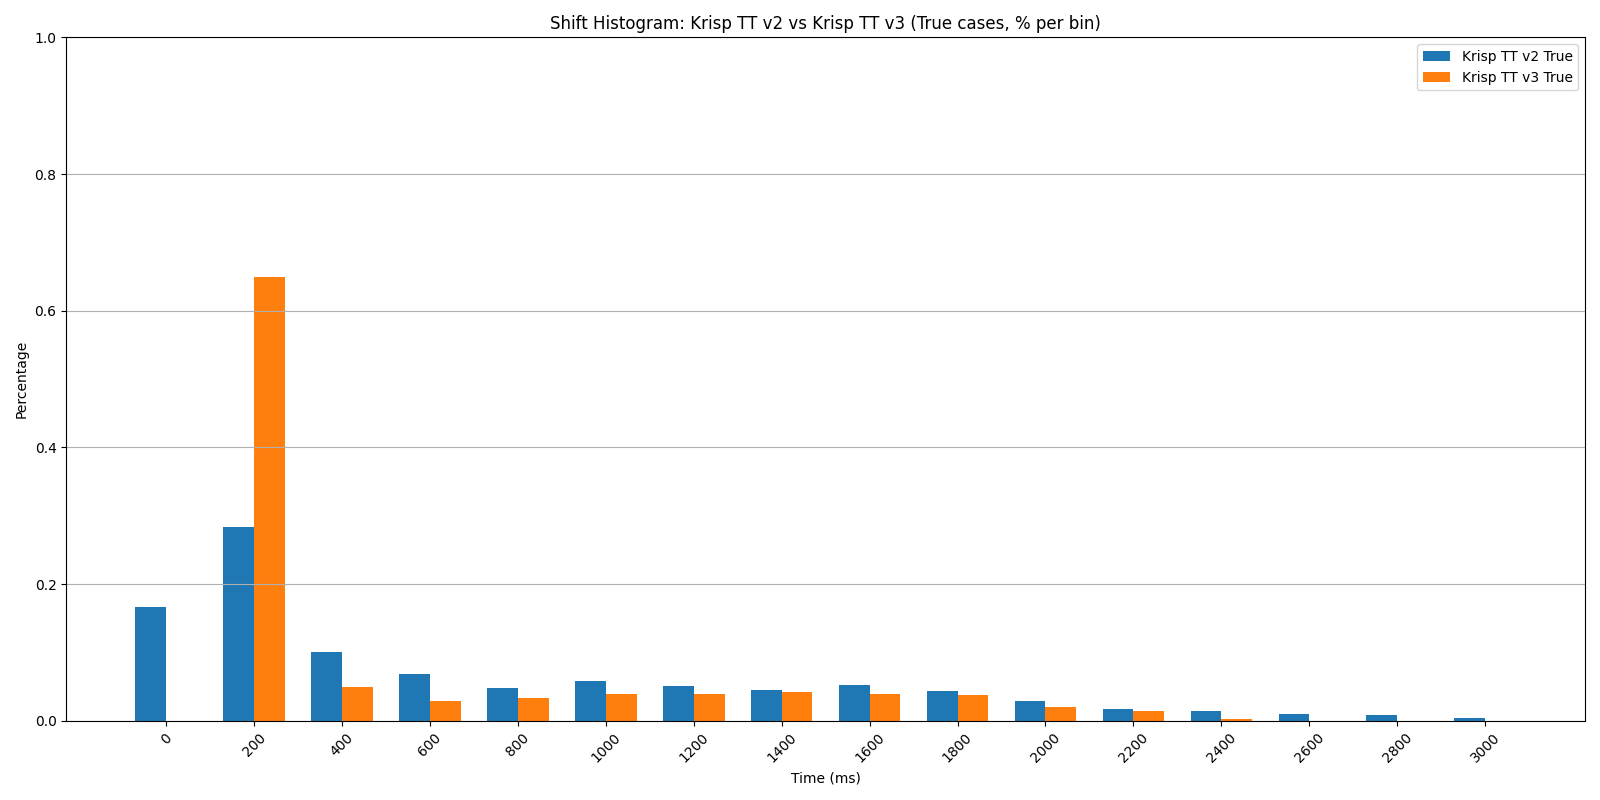
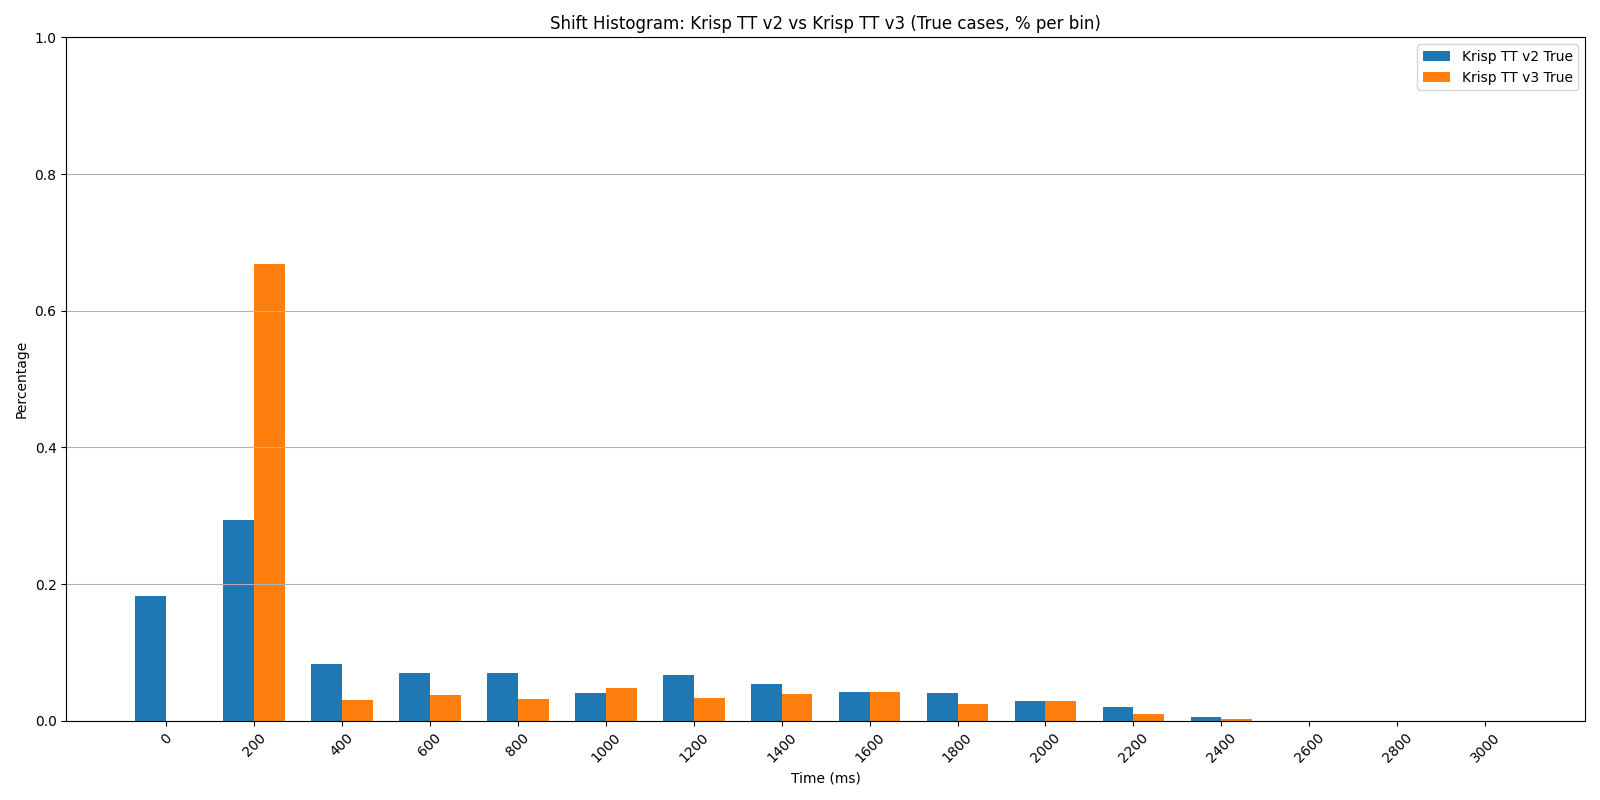
Shift Histogram: Krisp TT v2 vs v3 — true cases (% per bin), original dataset. v3’s mass concentrates sharply at the 200 ms bin.
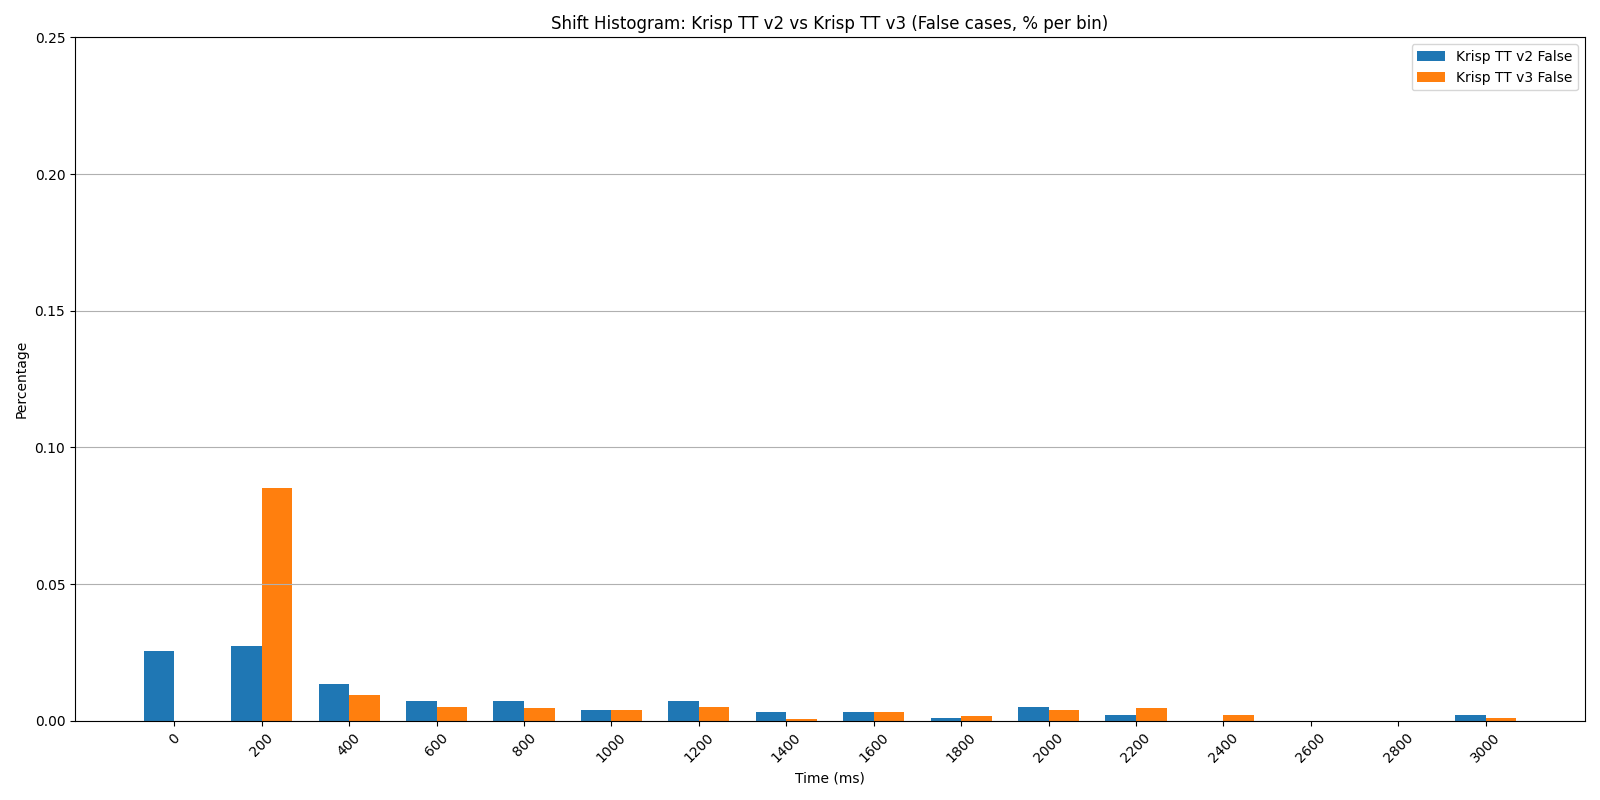
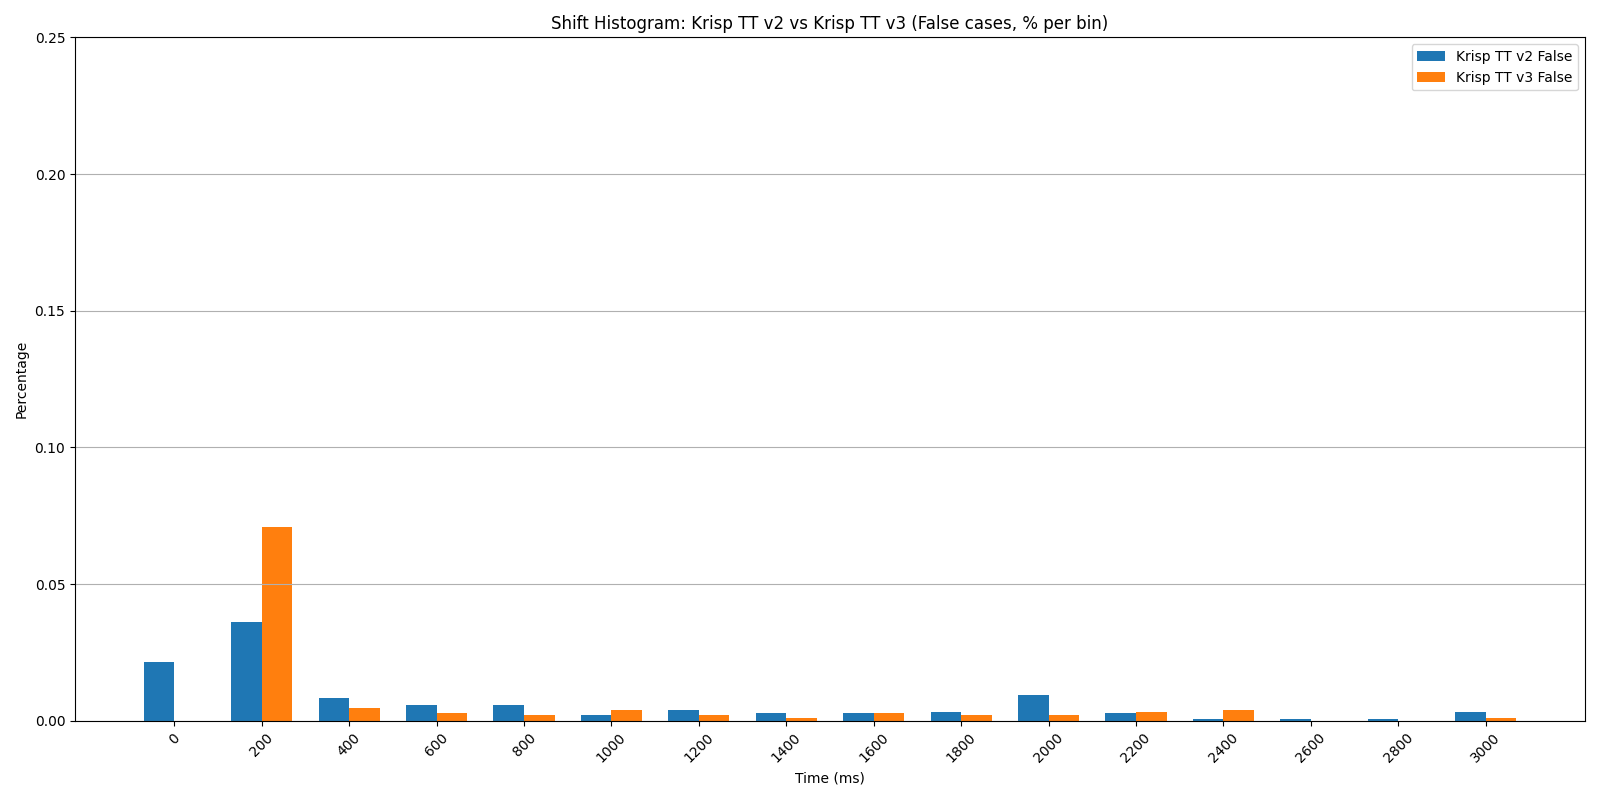
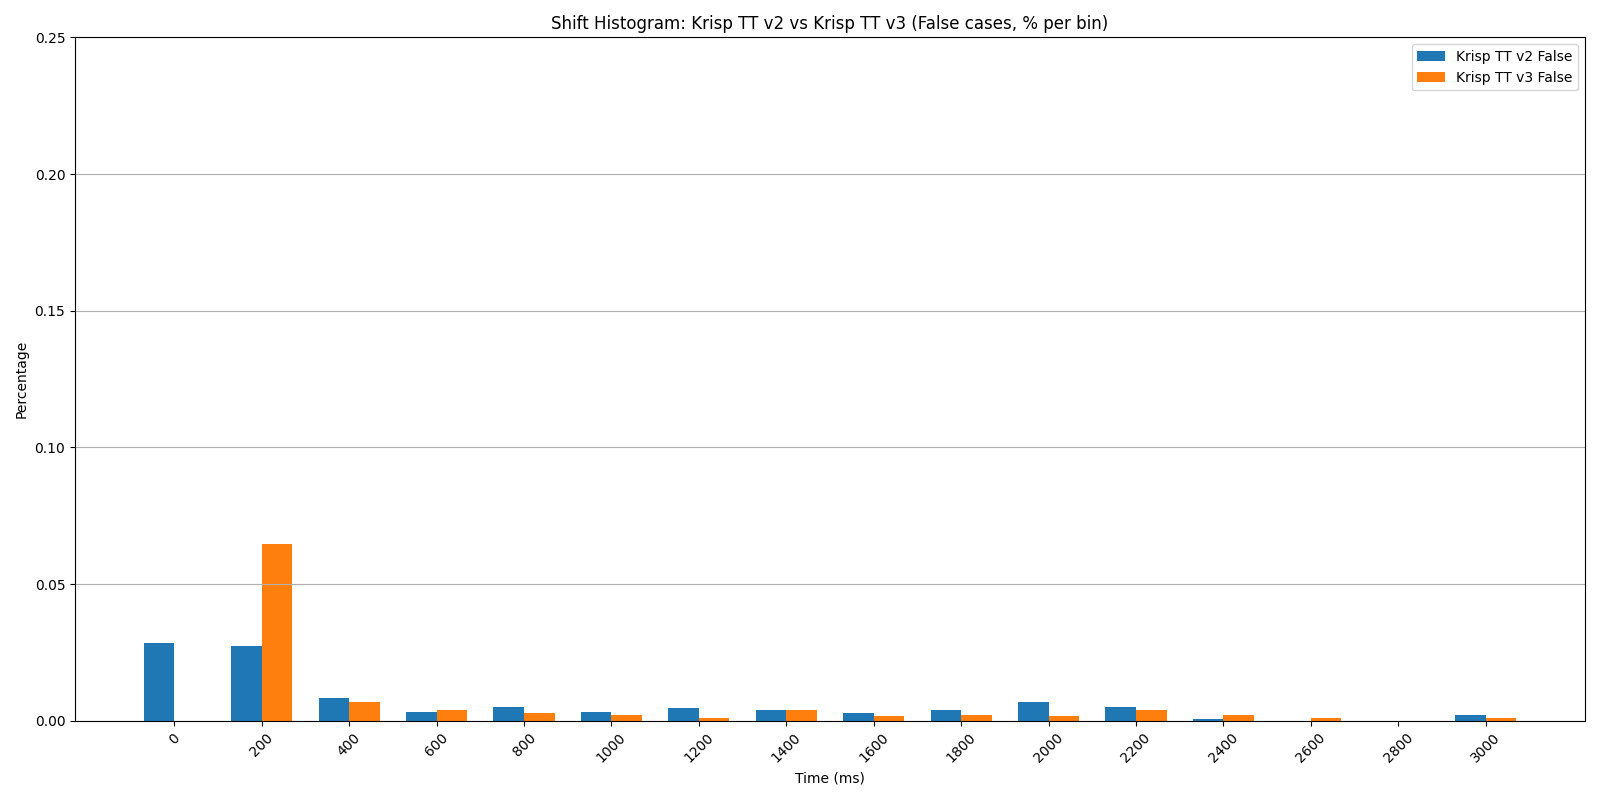 Shift Histogram: Krisp TT v2 vs v3 — false cases (% per bin), original dataset. Both models keep the false-positive mass low and comparable.
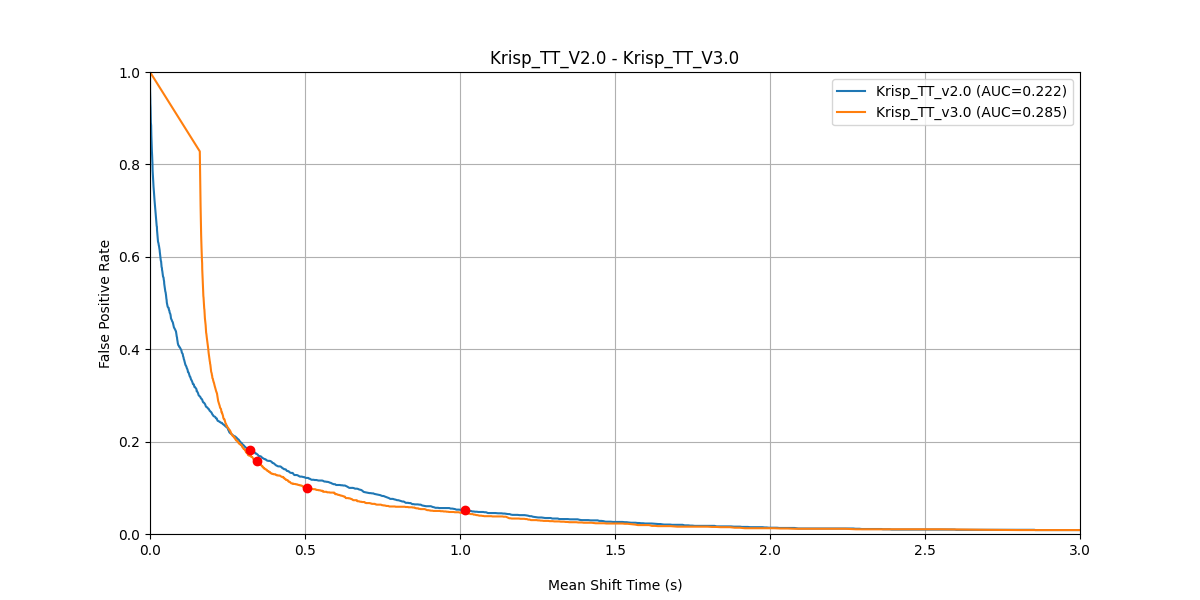
FPR vs Mean Shift Time — Krisp TT v2 (AUC = 0.222) vs v3 (AUC = 0.285), original dataset. Lower curve = faster reaction at the same accuracy.
The histograms tell the story visually: v3’s true-shift mass concentrates sharply in the 200 ms bin, while v2’s is spread across hundreds of milliseconds. At the same time, both models have a comparable false-positive rate, which means v3 is significantly faster without trading away accuracy, making conversations with voice AI agents feel more natural. Note that in this chart, AUC is the area under MST vs FPR curve.
Secondary mixes:
|
True ≤ 200 ms |
True ≤ 400 ms |
True ≤ 600 ms |
False Positive Rate |
| Turn Prediction v2 |
0.45 |
0.55 |
0.62 |
0.11 |
| Turn Prediction v3 |
0.65 |
0.70 |
0.73 |
0.13 |
 Shift Histogram: Krisp TT v2 vs v3 — true cases, secondary mixes.
Shift Histogram: Krisp TT v2 vs v3 — false cases, secondary mixes.
Noisy mixes:
|
True ≤ 200 ms |
True ≤ 400 ms |
True ≤ 600 ms |
False Positive Rate |
| Turn Prediction v2 |
0.48 |
0.56 |
0.63 |
0.11 |
| Turn Prediction v3 |
0.67 |
0.70 |
0.74 |
0.10 |
Shift Histogram: Krisp TT v2 vs v3 — true cases, noisy mixes.
Shift Histogram: Krisp TT v2 vs v3 — false cases, noisy mixes.
The advantage holds across all three conditions. With secondary voices and ambient noise — the actual conditions a model encounters in deployment — v3 maintains roughly the same gains it shows on clean audio.
Turn Prediction v3 vs SmartTurn v3.2
SmartTurn v3.2 is an open source model designed specifically for audio-based end-of-turn prediction. The comparison highlights both performance and design philosophy.
Original dataset:
|
True ≤ 200 ms |
True ≤ 400 ms |
True ≤ 600 ms |
False Positive Rate |
| SmartTurn v3.2 |
0.63 |
0.63 |
0.63 |
0.09 |
| Turn Prediction v3 |
0.69 |
0.73 |
0.76 |
0.10 |
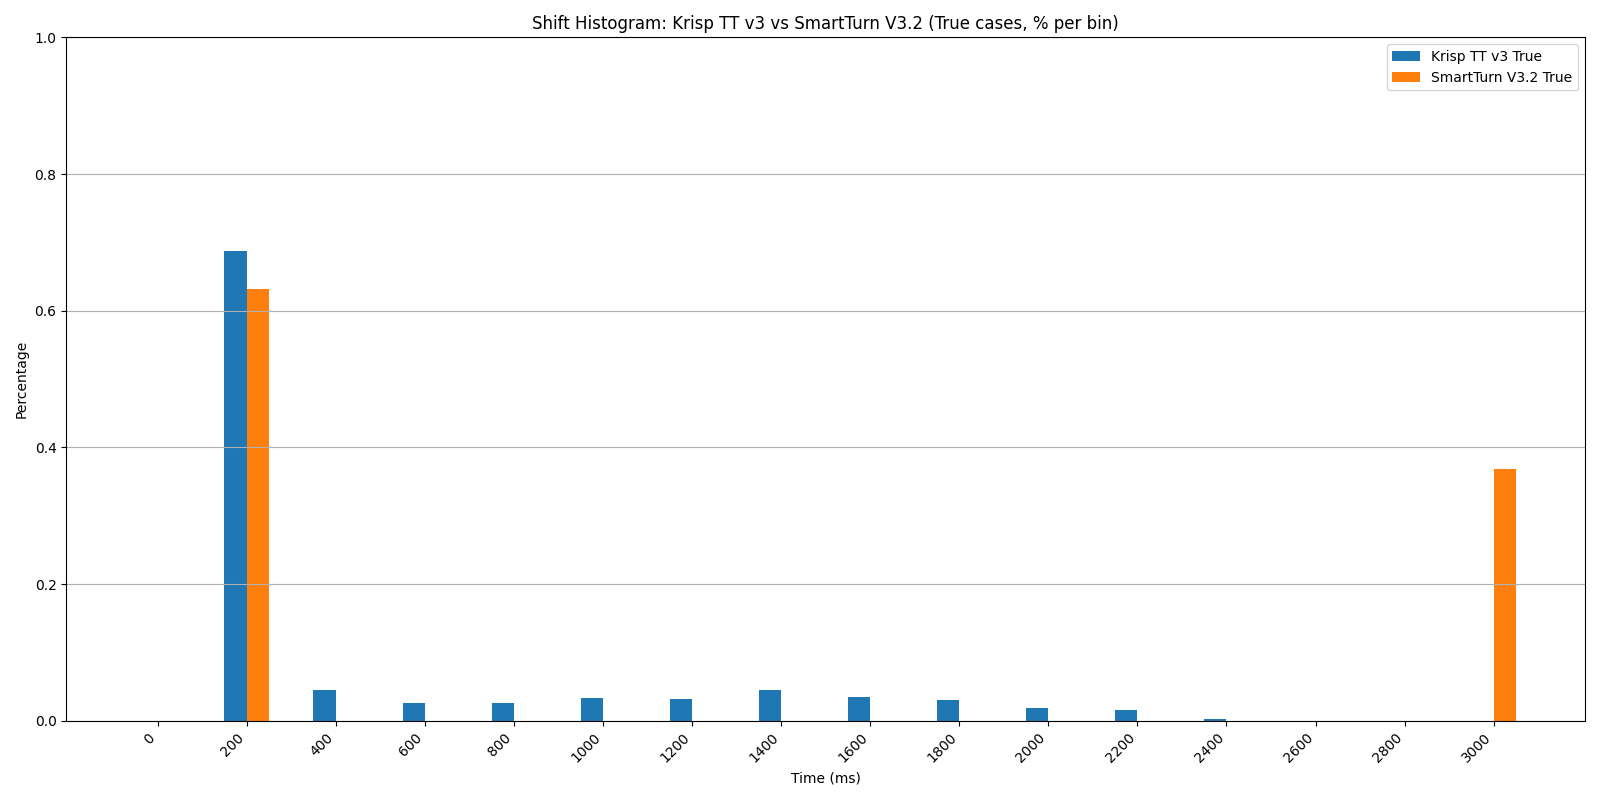
Shift Histogram: Krisp TT v3 vs SmartTurn v3.2 — true cases. SmartTurn’s mass is split between the 200 ms bin and the 3-second ceiling.
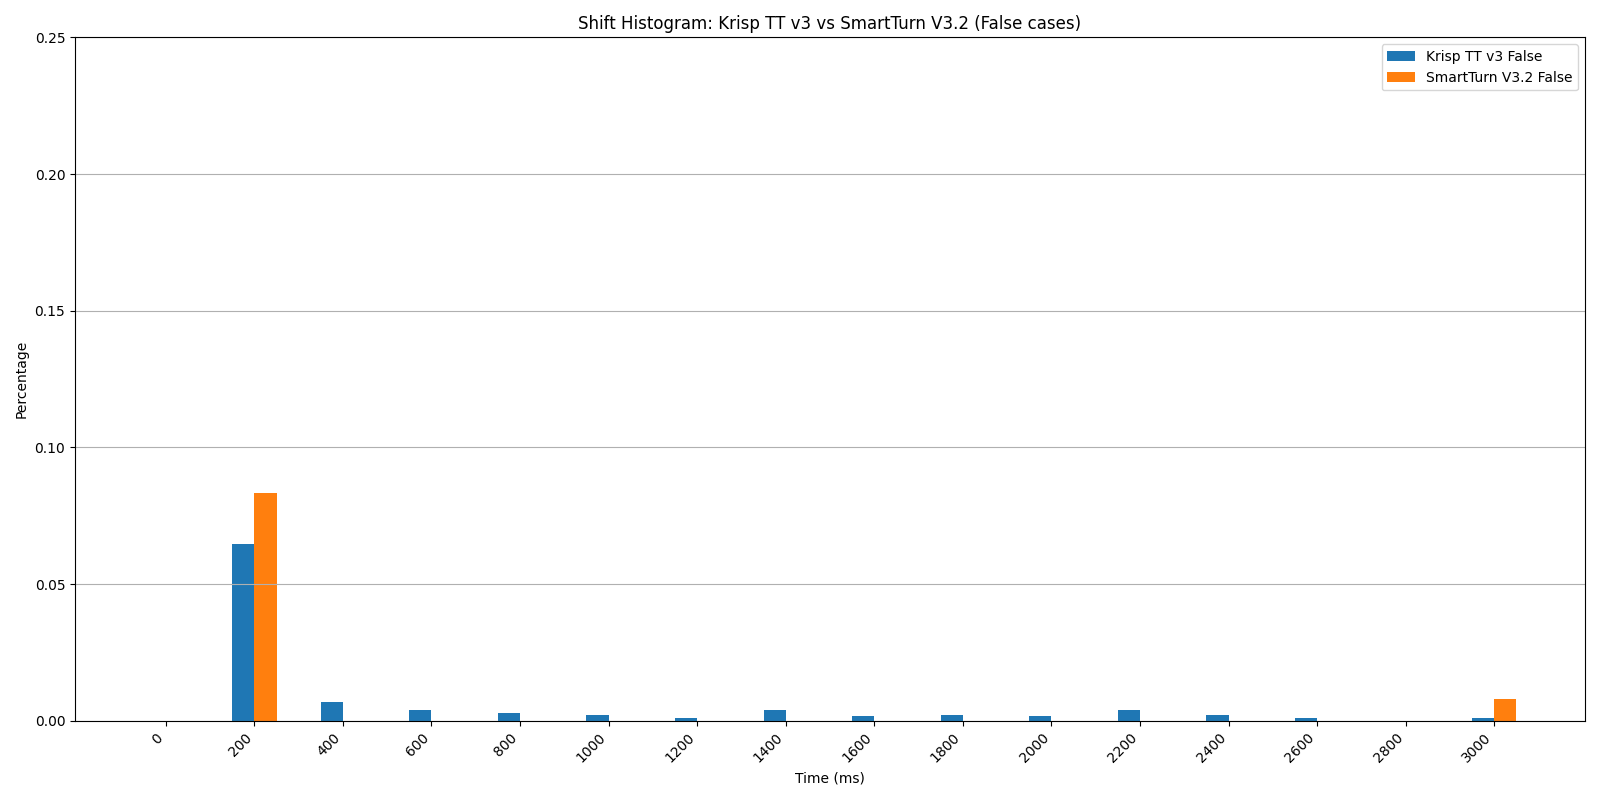
Shift Histogram: Krisp TT v3 vs SmartTurn v3.2 — false cases.
The uniform performance of SmartTurn across all temporal horizons (0.63 at 200 ms, 400 ms, and 600 ms) indicates a rigid, discrete triggering mechanism that is not leveraging the evolving context of silence (Pipecat implementation). In contrast, Turn Prediction v3 generates a continuous probability stream throughout the silence interval, offering a more sophisticated and granular approach that enables developers to precisely calibrate the latency–accuracy trade-off for their specific use cases. Crucially, Turn Prediction v3 captures 20% more turn-shifts within the 600 ms window (0.76 vs 0.63) — a critical segment for enabling the rapid, low-latency responses that define natural conversation.
The following charts illustrate the MST vs FPR trade-off across our three test conditions — clean audio, secondary voice mixes, and noisy mixes — evaluating performance both before and after BVC processing.
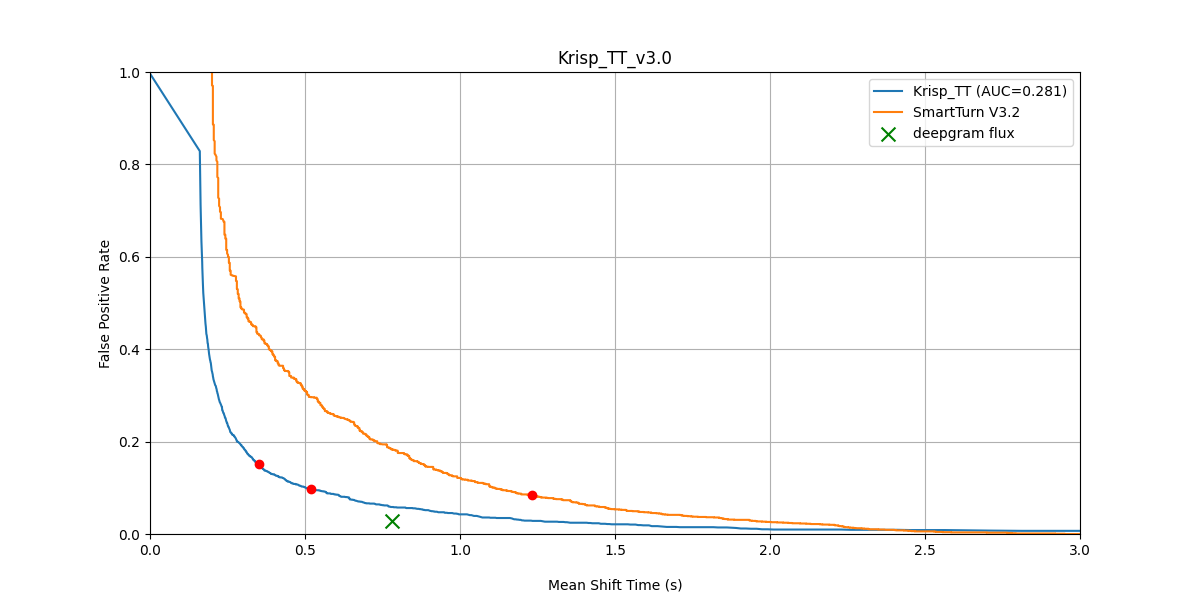
FPR vs Mean Shift Time — Krisp TT v3 (after BVC) vs SmartTurn v3.2 (before BVC), original dataset.
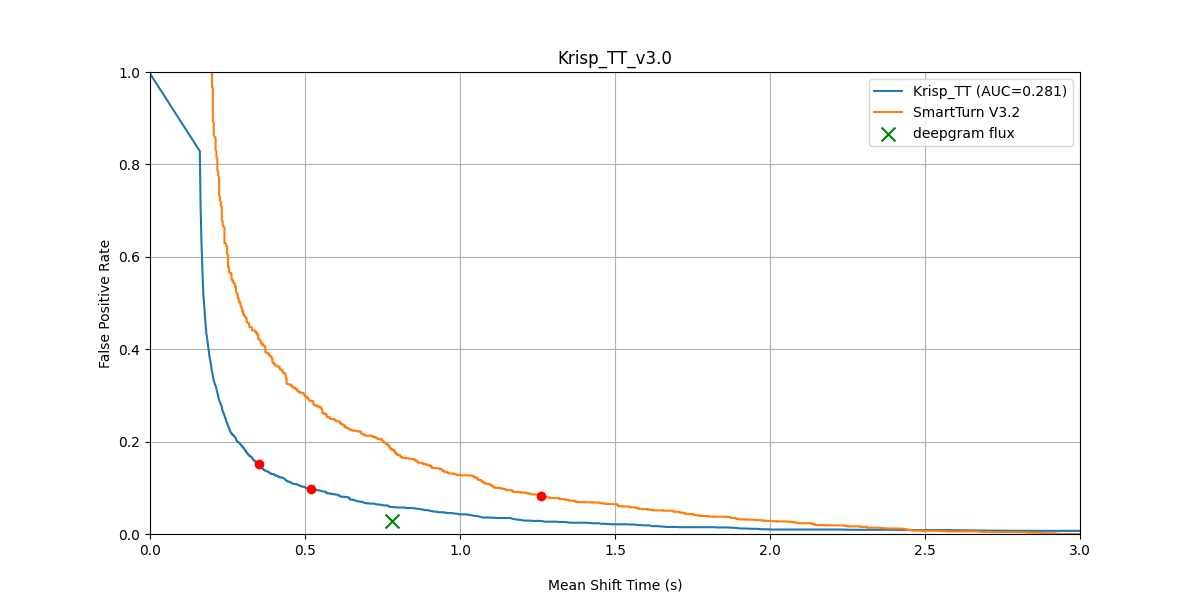
FPR vs Mean Shift Time — Krisp TT v3 (after BVC) vs SmartTurn v3.2 (after BVC), original dataset.
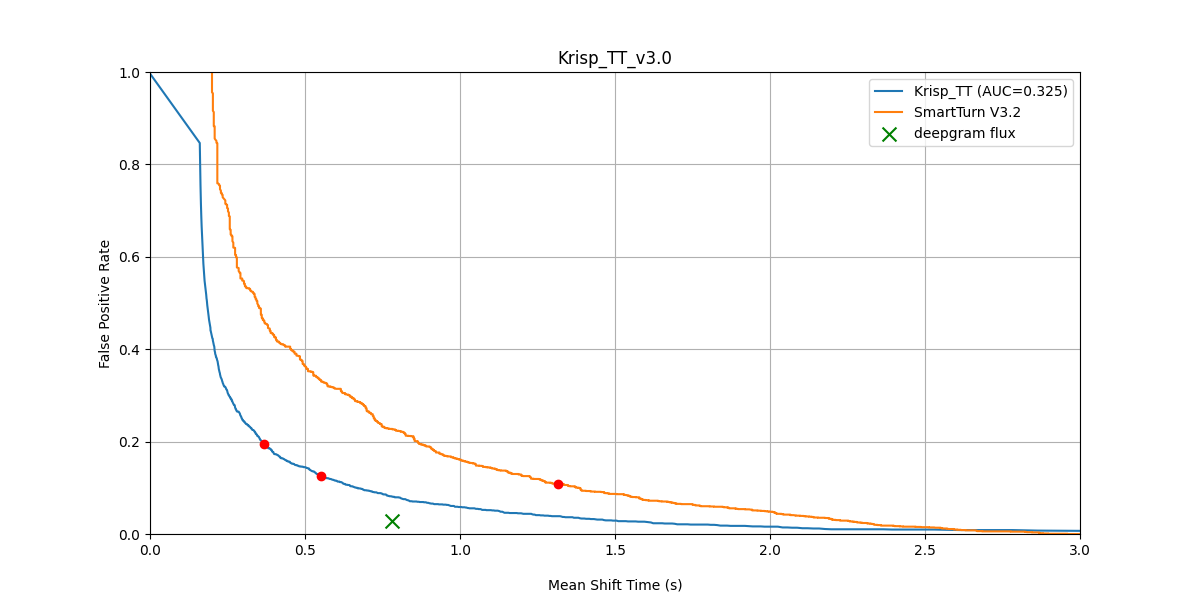
FPR vs Mean Shift Time — Krisp TT v3 vs SmartTurn v3.2, secondary mixes (both after BVC).
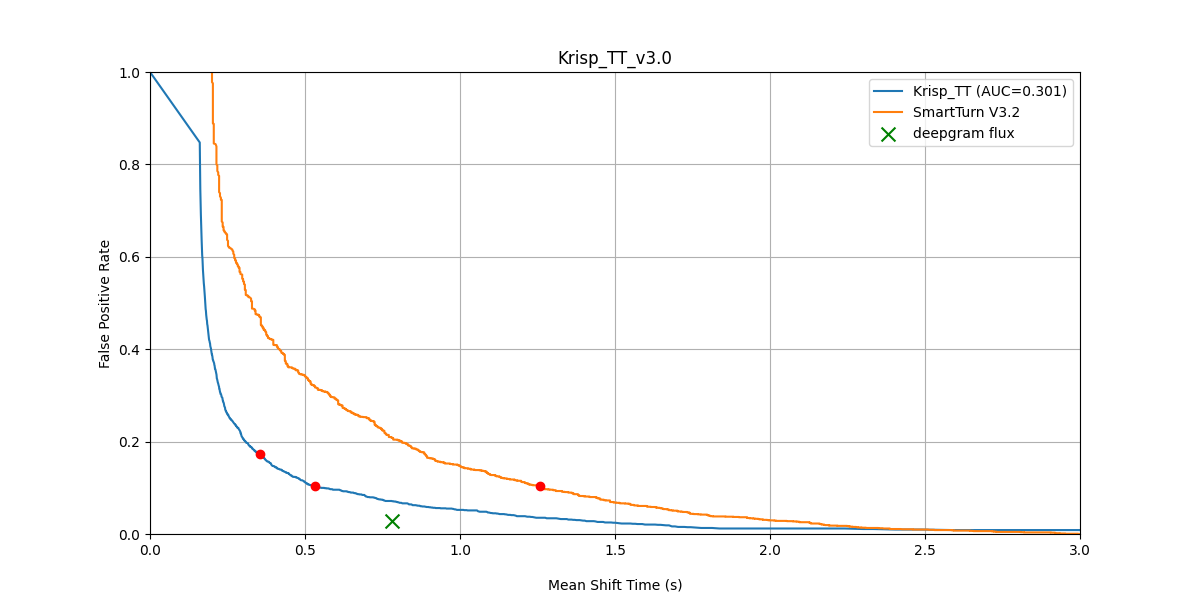
FPR vs Mean Shift Time — Krisp TT v3 vs SmartTurn v3.2, noisy mixes (both after BVC).
Across all three conditions and both before/after BVC, Turn Prediction v3 dominates the latency–accuracy curve.
Binary testing — full results across models
For readers who want a single comparison view, the table below collects binary metrics across all three datasets, three models (Turn Prediction v3, Turn Prediction v2, SmartTurn v3.2), and both before/after BVC.
Original dataset:
|
TP v3 (before BVC) |
TP v2 (before BVC) |
SmartTurn v3.2 (before BVC) |
TP v3 (after BVC) |
TP v2 (after BVC) |
SmartTurn v3.2 (after BVC) |
| Balanced Accuracy |
88.05 |
80.34 |
77.41 |
87.85 |
81.84 |
76.95 |
| AUC |
94.58 |
93.92 |
88.81 |
94.09 |
93.93 |
88.74 |
| F1 Score |
84.44 |
75.25 |
70.88 |
84.15 |
77.30 |
70.21 |
| F1 Score Hold |
91.20 |
89.09 |
86.44 |
90.98 |
89.48 |
86.27 |
Secondary mixes:
|
TP v3 (before BVC) |
TP v2 (before BVC) |
SmartTurn v3.2 (before BVC) |
TP v3 (after BVC) |
TP v2 (after BVC) |
SmartTurn v3.2 (after BVC) |
| Balanced Accuracy |
83.36 |
66.14 |
73.74 |
86.44 |
79.29 |
74.60 |
| AUC |
90.59 |
86.55 |
81.60 |
92.72 |
92.56 |
85.96 |
| F1 Score |
77.89 |
50.29 |
66.60 |
82.05 |
73.70 |
66.86 |
| F1 Score Hold |
85.59 |
83.20 |
78.93 |
89.32 |
88.48 |
84.37 |
Noisy mixes:
|
TP v3 (before BVC) |
TP v2 (before BVC) |
SmartTurn v3.2 (before BVC) |
TP v3 (after BVC) |
TP v2 (after BVC) |
SmartTurn v3.2 (after BVC) |
| Balanced Accuracy |
87.25 |
53.61 |
77.13 |
87.60 |
81.62 |
75.95 |
| AUC |
93.55 |
85.61 |
85.28 |
93.71 |
93.71 |
87.36 |
| F1 Score |
82.84 |
13.54 |
70.58 |
83.79 |
77.01 |
68.82 |
| F1 Score Hold |
89.50 |
79.53 |
83.42 |
90.74 |
89.42 |
85.16 |
The pattern is consistent: Turn Prediction v3 leads across all conditions and metrics. Performance is similar with and without BVC on the clean original dataset; BVC’s contribution is most visible on noisy mixes, where it lifts every model’s accuracy and is essential for v2’s competitiveness.
Turn Prediction v3 vs LiveKit and Deepgram Flux
We also evaluated Turn Prediction v3 against two other widely deployed solutions: LiveKit’s built-in and Deepgram Flux’s built-in.
A methodological note before the numbers: LiveKit’s TT is a text-based model — it operates on transcripts rather than raw audio. To make the comparison fair on audio data, we evaluated LiveKit using transcripts produced by the Deepgram Nova 3 ASR model. Deepgram Flux is English-only, so it appears in our English benchmarks but does not cover the multilingual scope of Turn Prediction v3.
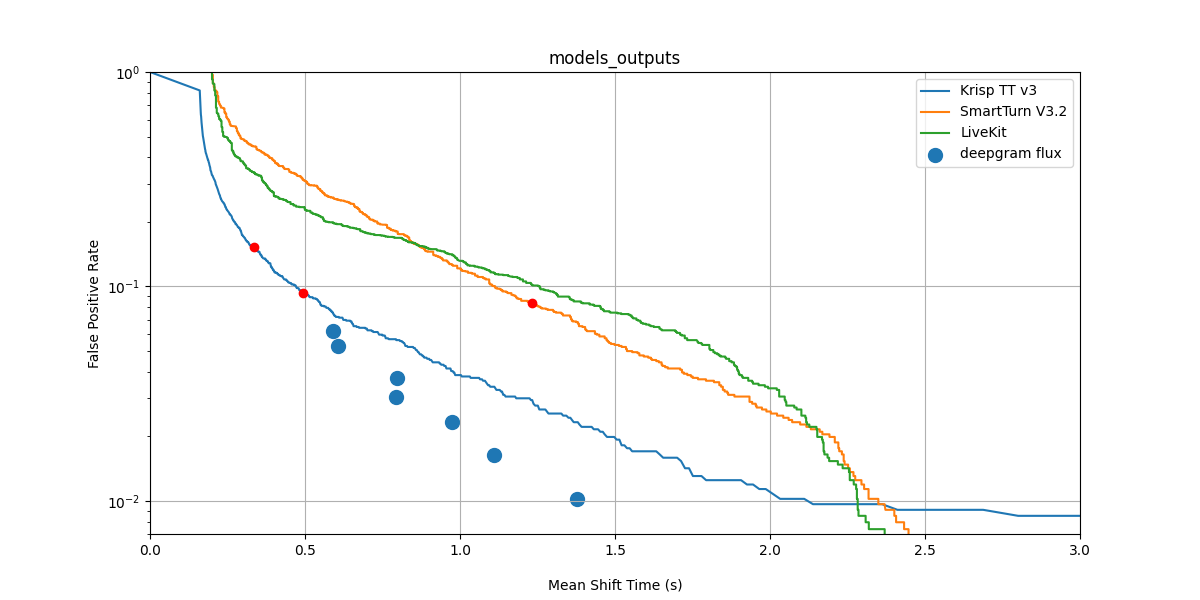
FPR vs Mean Shift Time — Krisp TT v3 vs SmartTurn V3.2 vs LiveKit vs Deepgram Flux. Krisp TT v3’s curve sits below SmartTurn and LiveKit across the operating range.
|
Balanced Accuracy |
AUC |
F1 Score |
F1 Score Hold |
| Turn Prediction v3 |
88.05 |
94.58 |
84.44 |
91.20 |
| SmartTurn v3.2 |
77.41 |
88.81 |
70.88 |
86.44 |
| Deepgram Flux |
87.10 |
— |
84.60 |
92.60 |
| LiveKit |
82.70 |
88.70 |
76.70 |
83.30 |
Turn Prediction v3 leads on Balanced Accuracy and AUC. Deepgram Flux is marginally ahead on F1 Score (84.60 vs 84.44) and F1 Score Hold (92.60 vs 91.20). Deepgram Flux end-of-turn prediction is English-only and is integrated within an ASR pipeline; the MST vs FPR plot also shows that Deepgram Flux achieves a lower mean shift time at the same FPR levels. Turn Prediction v3, by contrast, is a multilingual, lightweight model designed specifically for audio-based end-of-turn prediction. SmartTurn v3.2 and LiveKit trail across all four metrics, and their MST vs FPR trade-offs are comparable to each other.
Results: Interruption Prediction v1
Interruption Prediction is a fundamentally different task from end-of-turn detection: instead of judging when a speaker has finished, the model judges whether incoming user speech is a backchannel or a real interruption attempt. The metric framework, however, is structurally parallel.
Mean Interruption Time vs False Positive Rate
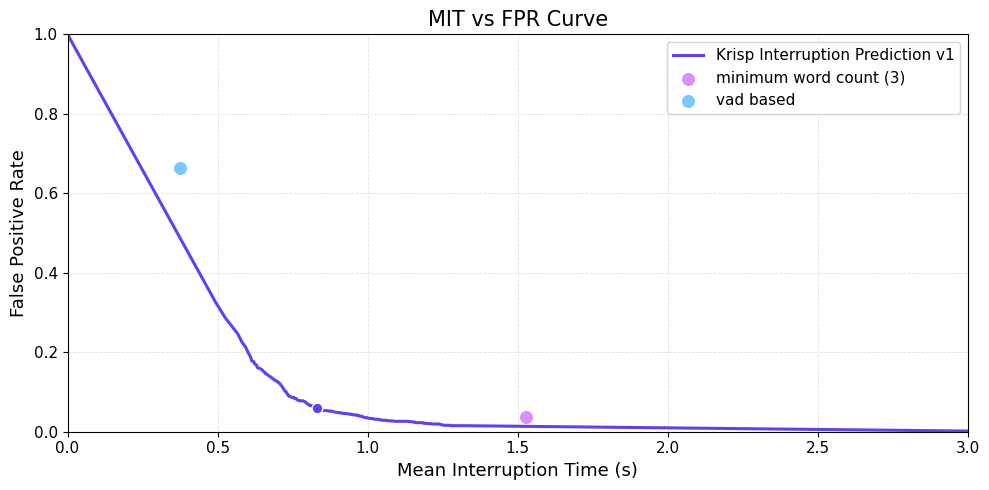
MIT vs FPR Curve — Krisp Interruption Prediction v1 across the threshold sweep, with VAD-based and minimum-word-count baselines plotted as single points.
The curve shows Interruption Prediction v1 across the full threshold sweep, with two industry baselines plotted as single points (since they don’t expose a confidence score):
- VAD-based: triggers an interrupt after a fixed duration of continuous user speech (Silero VAD, integrated in Pipecat).
- Minimum word count: triggers an interrupt after 3 words are recognized by Deepgram ASR (Pipecat default).
A lower curve means faster interruption at the same false-positive rate, or fewer false interrupts at the same speed. Krisp Interruption Prediction v1’s curve sits decisively below both baseline points across the operating range.
Threshold trade-off
| Method |
MIT (s) |
FPR (%) |
Balanced Accuracy |
F1 Score |
| Interruption Prediction v1 — threshold 0.4 |
0.833 |
5.9 |
0.906 |
0.871 |
| Interruption Prediction v1 — threshold 0.7 |
1.085 |
2.7 |
0.876 |
0.848 |
| Minimum word count |
1.528 |
3.6 |
0.948 |
0.927 |
| VAD-based |
0.375 |
66.3 |
0.675 |
0.583 |
Two operating points are worth highlighting. Threshold 0.4 is our recommended default — sub-second mean interruption time at under 6% FPR. Threshold 0.7 is the conservative setting: slightly slower but FPR under 3%.
The minimum-word-count baseline achieves higher balanced accuracy and F1 Score, but at the cost of substantially higher latency (1.5 s vs 0.8 s) — the bot waits much longer before stopping. VAD-based interruption fails the basic test: it fires on almost two-thirds of backchannels.
Robustness to non-verbal human sounds
Real conversations include laughter, coughing, and sneezing — sounds that are unmistakably human but are not interruptions. We evaluated each method on a separate set of non-verbal human sounds (200 laughter, 100 cough, 100 sneeze samples):
| Method |
False Positive (%) on non-verbal sounds |
| Interruption Prediction v1 — threshold 0.4 |
4.5 |
| Minimum word count |
0.0 |
| VAD-based |
32.0 |
Minimum-word-count is trivially robust here by construction — a cough produces no recognized words — but, as the previous table shows, pays for it with slow interruption response on real speech (1.5 s MIT). Interruption Prediction v1 stays below 5% false positives on non-verbal sounds while keeping interruption response well under one second. That’s the trade-off most production deployments will want.
Availability
Both Turn Prediction v3 and Interruption Prediction v1 are available in the Krisp VIVA SDK and integrated into Pipecat:
- Turn Prediction v3 — krisp-viva-tp-v3, ~9M parameters, 30 MB, configurable frame duration, 12+ languages, recommended threshold 0.5
- Interruption Prediction v1 — krisp-viva-ip-v1, ~6M parameters, 24 MB, 40 ms frames, English, recommended threshold 0.4
Both models are designed for low resource consumption on CPU — no GPU required for real-time inference.
FAQ
What is turn-taking in voice AI, and why does it matter?
Turn-taking determines when a voice AI agent should start speaking (after the user finishes) and when it should stop (when the user interrupts). Poor turn-taking causes awkward silences, cut-offs, and agents that halt mid-sentence because the user said “uh-huh.” It’s the single biggest factor in whether a voice agent feels natural or robotic.
How does Krisp’s end-of-turn detection differ from text-based approaches like LiveKit’s?
Krisp Turn Prediction v3 operates directly on audio rather than on ASR transcripts. It supports multilingual input without requiring per-language ASR, and makes decisions based on acoustic cues (prosody, pausing patterns) that get lost in transcription.
What’s the difference between a backchannel and an interruption, and why can’t VAD handle it?
A backchannel (“yeah,” “uh-huh,” “right”) signals engagement without requesting the floor. An interruption means the user wants the agent to stop. VAD only detects that someone is speaking — it can’t distinguish intent, so it fires on nearly two-thirds of backchannels. Krisp Interruption Prediction v1 uses a learned model that separates the two with under 6% false positives at the recommended threshold.
How fast can a voice AI agent respond using Krisp Turn Prediction v3?
At the recommended threshold (0.5), 69% of true turn-shifts are detected within 200 ms of silence — a 47% improvement over v2. The model runs on CPU with ~9M parameters and 30 MB footprint, so it adds negligible overhead to your voice agent pipeline.
What languages does Krisp turn-taking support?
Turn Prediction v3 supports 12+ languages: English, German, French, Spanish, Hindi, Finnish, Italian, Portuguese, Chinese, Japanese, Korean, and Russian. Interruption Prediction v1 is English-only at launch, with additional language support planned.
Related Resources